Use Indicators to Determine Entry Points in Forex
Once you’ve determined the market’s direction, the next step is to devise an effective entry trading strategy. Every forex trader hopes the forex market will move in the direction of their entry—there’s nothing worse than the market moving in the opposite direction after entry. Successful forex traders have one important characteristic: they accumulate facts when making an effective, constructive decision. The more facts they accumulate, the stronger the validity of their decision.
In trading, one part relies on skill, and nine parts rely on emotion. This is why emotions often hinder us from making the right decisions. Never make any decisions when you’re very emotional; you should take some time to calm down and return to a state of clear logic; this is when your left brain will be activated, wisdom will be unlocked, and the left brain is where you store knowledge. The knowledge you’ve learned before will also be awakened, allowing you to make positive, constructive decisions.
Trading indicators can help you avoid using your right brain, where emotions are stored. You can execute buy and sell orders programmatically based on price movements without any emotional colour.
Using several different indicators together can help you capture more effective entry points, as shown in the figure below. However, they also require you to constantly monitor forex market fluctuations. The trading system you see in the figure below is the MT4 short-term trading system.
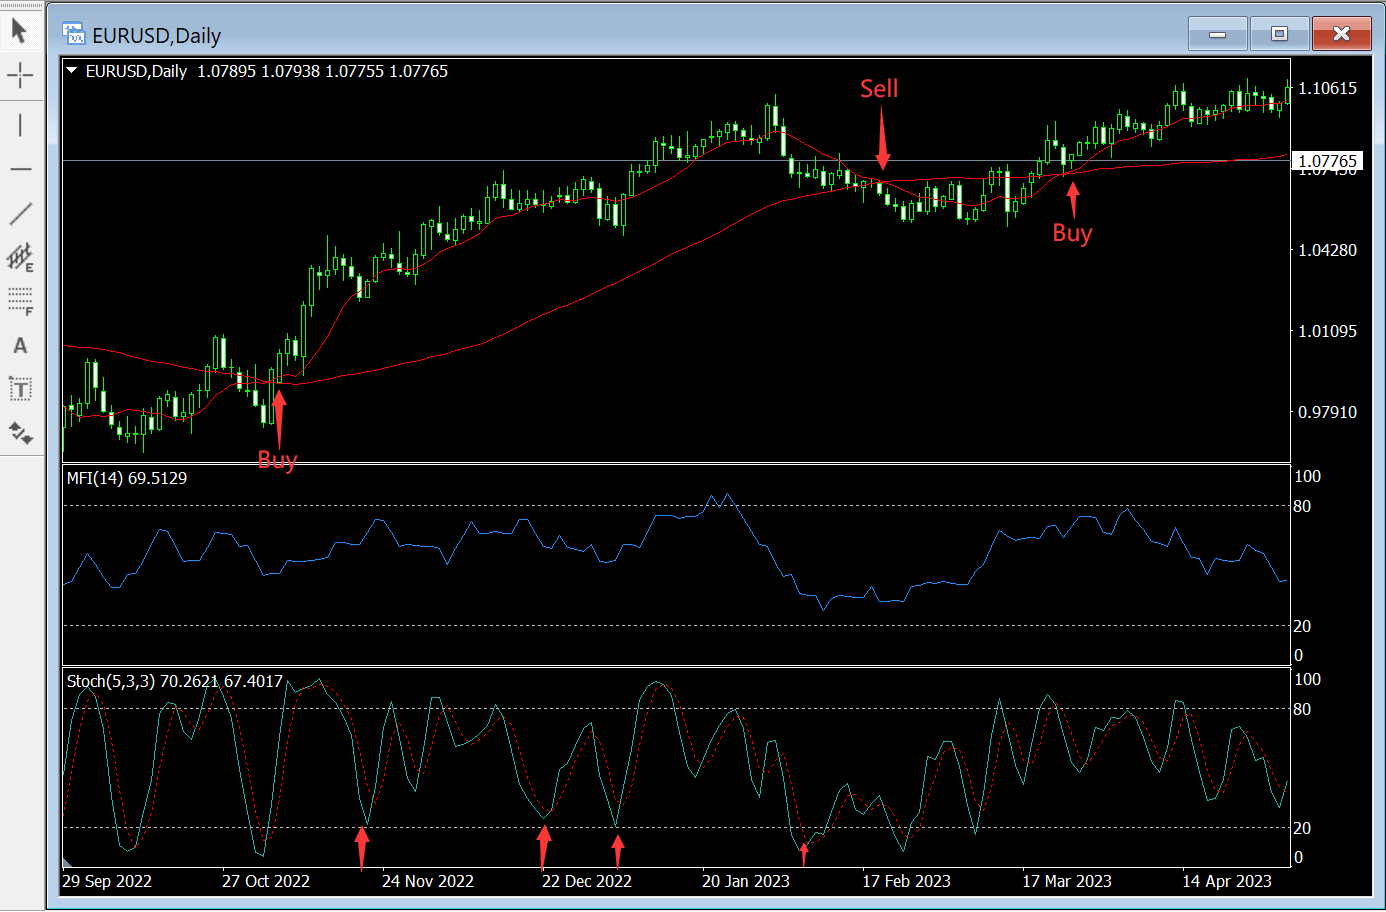
The two moving lines on the candlestick chart are called moving trend lines, which you can use to determine buy and sell signals. The one closer to the candlestick chart is the short-term trend line, and the other is called the mid-term trend line. When the short-term trend line crosses the mid-term trend line from above, you can go short, and when the short-term trend line crosses the mid-term trend line from below, you can go long.
As you can see in the figure below, if you use the moving trend lines as entry and exit signals, around Nov 4, 2022, when the two lines crossed, you might have bought euros near 0.9955; until around Feb 20, 2023, when the two lines crossed again, you would sell at 1.0680, making a profit of 725 points. That is to say, if you use 1 lot size, you could get a profit of $725 in four months (assuming you are trading long-term).
The question is, if the two moving trend lines have already crossed, how should you enter the forex market? Do you have to wait three or six months for the next entry opportunity until they cross again? The answer is, of course, no. At this point, you have two choices: either you train yourself to judge the forex market direction without those indicators, or you learn to add other indicators to the trading system, like the waveform line you see at the bottom of the figure below.
This indicator is called the MT4 trend tracking indicator, which can be used to monitor forex market fluctuations. forex Market fluctuations are like waves, not achieved overnight, but undulating, back and forth, up and down, taking three steps forward and two steps back.
Before the trend creates higher highs and higher lows, it may take a step back or half a step.
The greatest thing about a forex trading system is that it constantly monitors the forex market changes, providing you with entry and exit signals 24 hours a day, whether you’re resting or working. With a trading system, you’re in control of the trades, not the market controlling you. You can remain calm in the face of forex market movements, and you can even turn off your computer without having to reanalyze the market with various new technical analysis methods from the time you left.
If the trend lines crossed while you were away from your computer, the MT4 trend tracking indicator still helps you enter the market at a very likely reversal point, which is what every forex trader dreams of. Look at the trend tracking indicator below the chart, where the black upward arrows are. When the moving trend line first goes down and then U-turns up, you should enter the market following the trend. By watching the forex market’s next price moves, you can see how the market starts to bounce back.
Whether in an uptrend or a downtrend, this trading system works just as well. As you can see in the chart below, all the rules are the same; they’re just in the opposite direction.
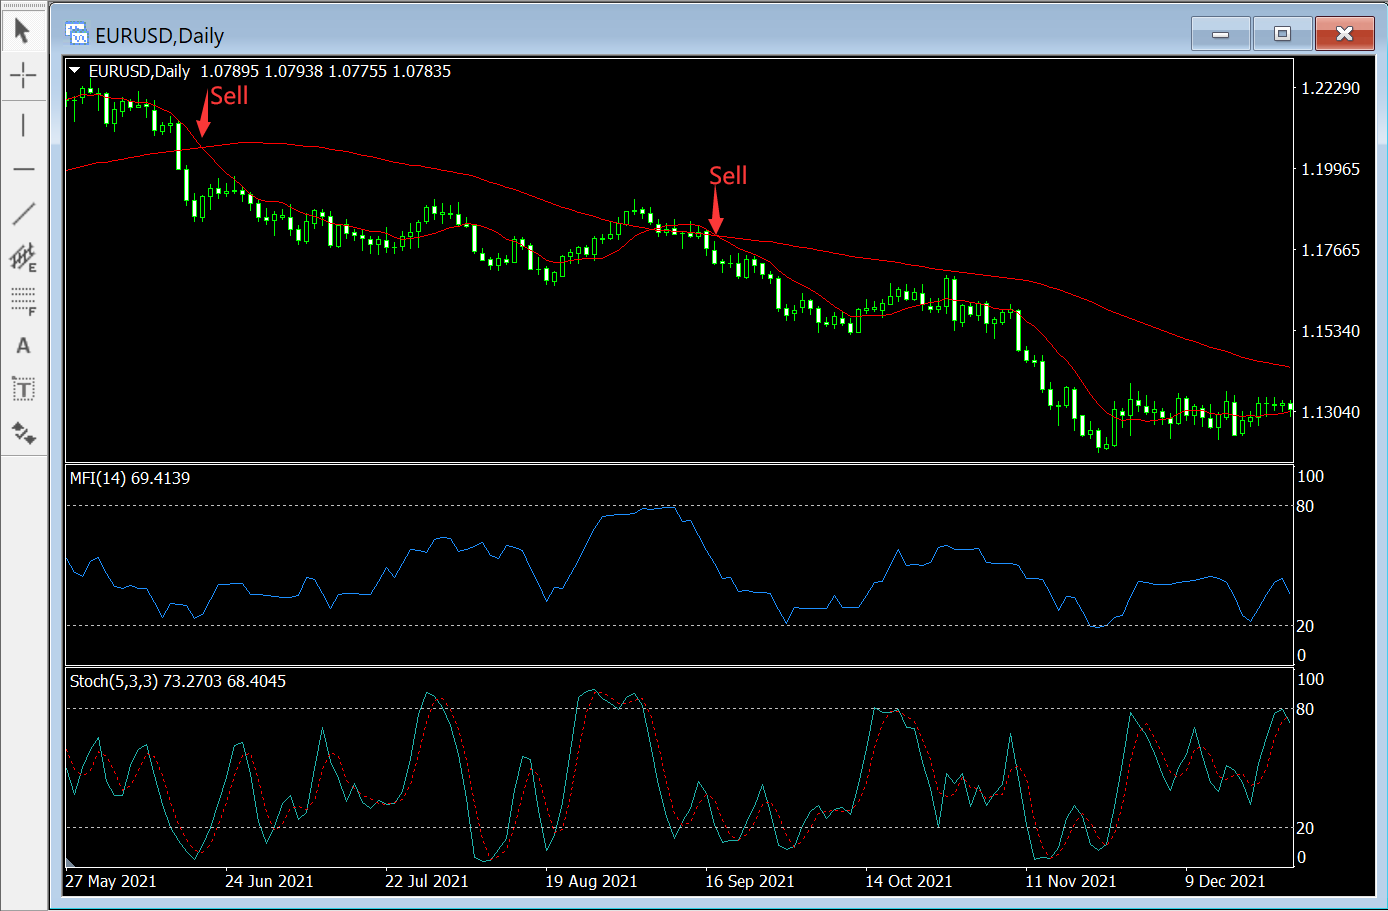
When the trend lines on a candlestick chart cross from above to below, going short is often a good choice. To emphasize again, if you open the chart and find that the moving trend lines have crossed, this presents a short-term signal. You can enter the market when the MT4 trend tracking indicator shows a U-shaped reversal from above to below. Observing the forex market’s behaviour during the downward U-shaped reversal and filtering out false signals with trading indicators can help you focus on creating a long-term effective trading strategy.
Some forex traders like to react quickly, treating their computers like video games—they constantly try to profit from the market through “scalping” forex trades. In and out, over and over, up to 10 times a day. If you’re one of those forex traders who enjoy scalping, you might use charts with 5 to 30-minute intervals. If you’re interested in day trading, then your system should use 1 to 4-hour interval charts. If you’re into long-term trading, then 4-hour, daily, or even weekly charts would be suitable. Regardless, a significant part of this work can be delegated to the computer.
It seems simple, doesn’t it? It looks just like an autopilot system. If it were that easy, we’d all be living in upscale neighborhoods by now, flying private planes to our seaside vacation homes on weekends. But that’s not the case.
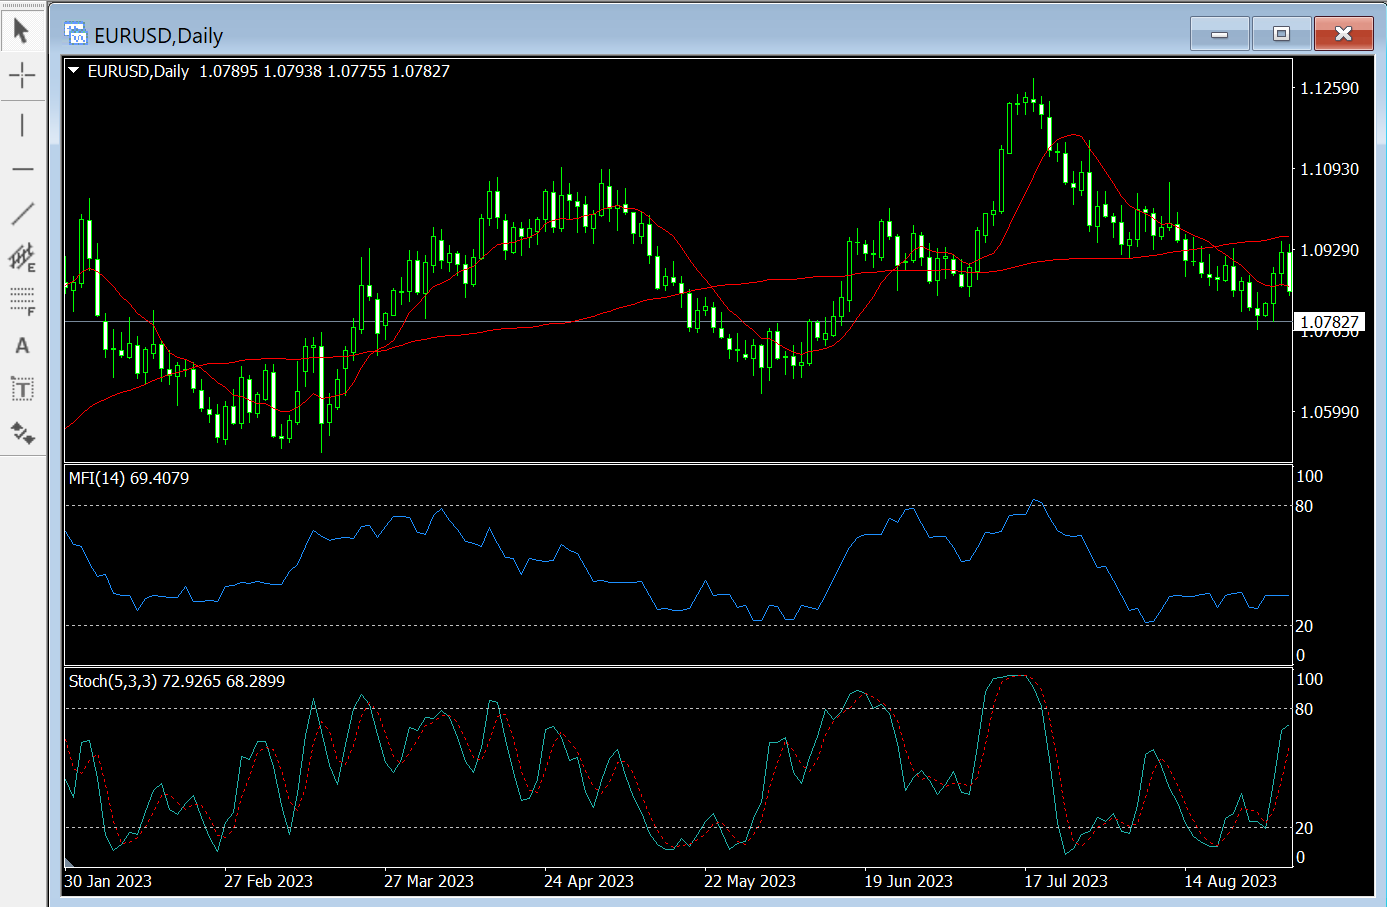
Most forex traders get green pips following trends and lose when the forex market becomes chaotic or starts to consolidate sideways. Sideways consolidation refers to the market solidifying within a range over a period, forming tops and bottoms that are the same or similar (as seen in the chart below).
What do you do if the market starts to consolidate sideways just as you’re about to enter, and it keeps strengthening? As shown in the chart below, every time the computer gives a buy signal, the forex market starts to move down; and every time it gives a sell signal, the market reverses upwards. Most people feel intimidated when they step into an aeroplane cockpit and see all the complex instruments, thinking, “I could never do that job.” But the truth is, they can.
How do I know? Just like in the 1980s, when I first saw those charts on the computer, I was quite intimidated. But believe it or not, sideways consolidation sometimes offers more profit opportunities for forex traders than trend trading. Imagine, in the chart below, entering at every low point and exiting at the highs; then doing the opposite, selling at the highs and holding until the channel’s lower lows to exit. Clearly, if you repeat this process, it can also bring you considerable profits.
Use Indicators to Determine Exit Points in Forex
If you hold a long position in the forex market, meaning you’ve bought in anticipation of the market rising, each of your buy orders should be matched with two sell orders—one for profit and one to stop losses. Conversely, if you hold a short position, having sold first, each sell order should be matched with two buy orders—again, one for profit and one to stop losses. After entering the market, you need two exit points: one for taking profit and another to protect your capital, so you don’t get knocked out by a single trade.
The truth is, no one knows exactly where the market will go next. What you should do is understand how the market operates and learn to follow it, much like sailing the seas—sometimes predictable, sometimes not. Success often belongs to those who understand how it works. Just look at those who’ve built great companies and transport goods, passengers, and even crude oil across the oceans.
If the forex market moves in your favor after you enter, the next question is where to exit. Your only job is to guess where the market will go next. Let’s use a mathematical approach to calculate price movements—it’s better than waiting for time to tell you where the market will head. Of course, you can also use your indicators to decide when to exit.
Remember those two indicators? One is the moving trend line that overlaps with the candlestick chart, and the other is the MTI trend tracking indicator below the chart. If you’re holding a long position and want to be a long-term forex trader, you can hold your position until the moving trend lines cross downwards.
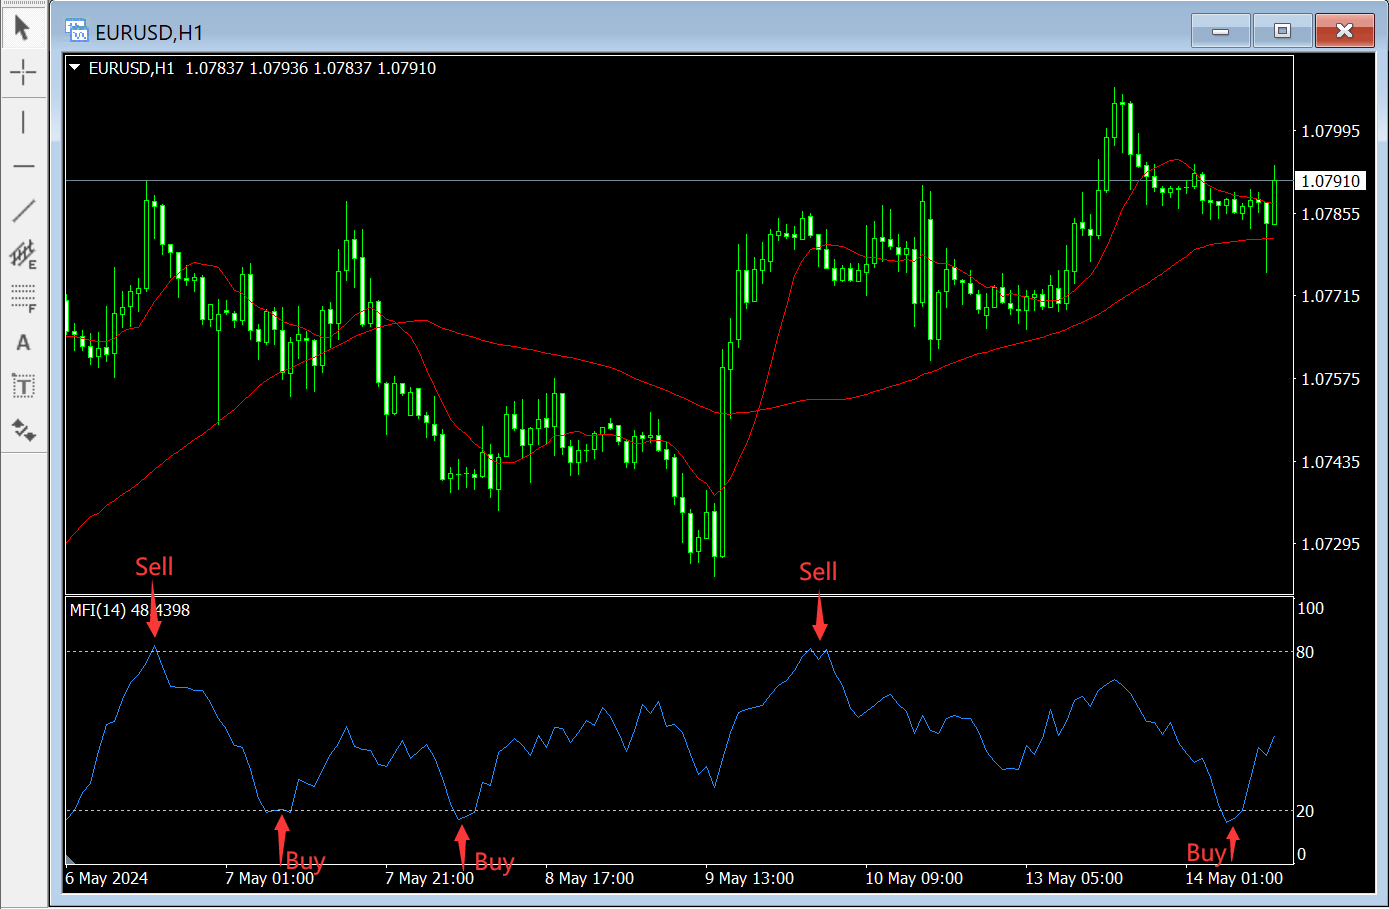
But if you’re just looking to make a few points, you can use the MT4 trend tracking indicator below the chart. Exit when the indicator moves from below to above and starts a downward U-turn (as shown in the diagram below).
Some forex traders use the movement of indicators as the basis for setting their protective stop-loss orders—meaning they rely entirely on those indicators to decide how to hold a position. I don’t recommend this because it’s precisely the kind of behaviour that lets emotions dictate your decisions. How does it influence you? Without a clear exit point, you fall into the trap of hope and fear coexisting. Once the forex market moves against you and you’re hoping the indicator will tell you how to exit with minimal loss, guess what happens? Hope and fear will continue to dominate you.
If you hold a long position, the best place to set a stop-loss is just below the nearest support level; if you hold a short position, it should be just above the nearest resistance level. Finding and calculating the position of your stop-loss order is a crucial step in your trading plan. Once you’ve found that spot, you must immediately place a stop-loss order after entering. If you’re trading OCO orders (one cancels the other), don’t tamper with them arbitrarily.
The ideal state of trading is to cut losses and let profits “fly” as long as possible. The problem is, most forex traders tend to cling to losing trades and quickly close out profitable ones, driven by “hope and fear.” They hold onto losing positions for days, enduring the agony they bring, struggling on the edge of despair, praying and hoping, and beseeching “God” and anyone who hears their cries to help them break even. Once their wish comes true, they hastily close out their positions after making only a few points in profit. Some forex traders endure the agony of a 300-point loss, only to exit with a mere 2-point gain.
For beginners in trading, it’s crucial to learn how to make a trading plan and set stop-loss orders before going live. Here are some trading tips for newbies:
-
Your exit strategy must be straightforward and within your risk tolerance.
-
Trade on shorter time frames, like 30, 15, or 10 minutes. Keep your strategy simple with clear entry and exit points, even if it’s just for 10-20 points of profit. That means a mini lot (10,000 USD) could get 10-20 USD, and a standard lot (100,000 USD) could get 100-200 USD.
-
The most important thing in the early stages is to develop successful trading habits and trading plan. Once you’ve established the basic habit to get more than losing, you can start learning more advanced exit strategies.